

Confused by all the candles, lines, and spikes in forex charts?
You’re not alone. Learning to read forex charts is the first step toward smart currency trading—and it doesn’t have to be complicated.
This beginner’s guide will show you how to study forex charts with clarity and confidence.
Table of Contents
What Is a Forex Chart?
A forex chart is a visual representation of currency price movements over time. It helps traders analyze past performance and predict future trends between two currency pairs, like EUR/USD or GBP/JPY.
Technical analysts and day traders use these charts to identify the trends, continuations, and various patterns that can signal reversals, entry points, and exits. Several traders use these charts to determine the likely direction of a given currency pair in conjunction with other technologies like online trading to get an edge in the forex market. The most common types of forex charts are line graphs, bar charts, and candlestick charts on any trading platform.
Types of Forex Charts
1. Line Chart
- Simplest form
- Connects closing prices over a time period
- Best for identifying overall direction (trend)
2. Bar Chart
- Shows open, high, low, and close (OHLC)
- More detailed than a line chart
- Used for spotting price volatility
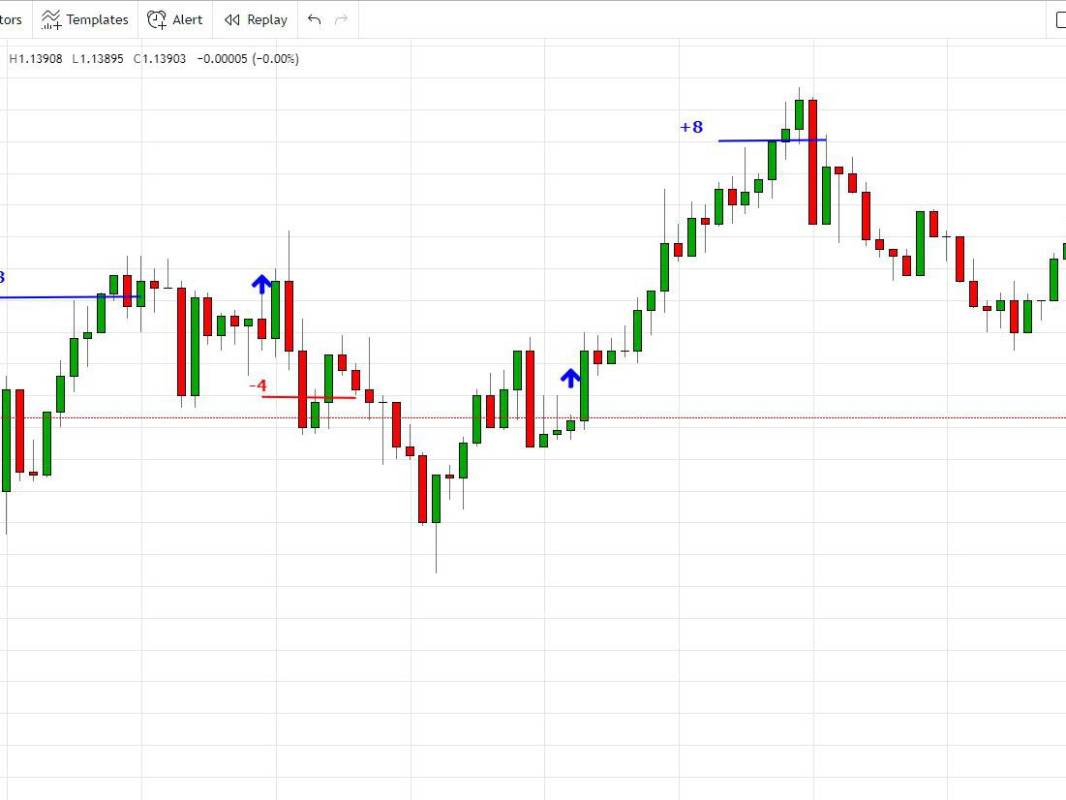
3. Candlestick Chart (Most Popular)
- Displays same OHLC info with color-coded candles
- Green = Bullish (price went up)
- Red = Bearish (price went down)
- Ideal for pattern recognition
Key Components You Must Understand
| Element | Meaning |
|---|---|
| Currency Pair | The two currencies being compared (e.g., USD/JPY) |
| Time Frame | 1-minute, 1-hour, daily, or weekly intervals |
| Volume | Shows how much of a currency is traded |
| Support & Resistance | Levels where price historically bounces or reverses |
| Trend Lines | Help determine direction: upward, downward, or sideways |
Understanding Forex:
According to analysts, the purpose of a forex chart is to allow the trader to view the past, which can predict the future. To make it easy and convenient for their clients, many forex brokers provide free forex charting software to those with funded and open trading accounts.
Forex charts are essential for those who use their technical analysis to determine where to invest their funds and be interested in studying the latest trend. These technical analysts can reveal the latest trend using the forex.
The technicians study Forex to predict the investments to be carried out in the future beforehand. This is made possible because of the ability of the technical analysts to check and review the past and recent market prices. These analysts believe that the demand and supply forces in the market result in short-term price movements. Thus they end up concluding with the fact that the basics of assets when compared with the current balance of sellers and buyers are less relevant.
Tools to Study Forex Charts
Here are some platforms and tools ideal for beginners:
- TradingView – User-friendly, powerful charts, free and paid versions
- MetaTrader 4/5 – Popular among brokers, highly customizable
- ForexFactory – News + sentiment tools
- Investing.com – Easy-to-use, good for mobile
- OANDA – Reliable live data for major pairs
How to study the different types of forex charts:
There are four types of charts used by forex traders, i.e., candlestick, HOLC or bar, line graph and mountain chart.
Information on each chart is given below:
Candlestick chart:
Candlestick chart is used to display pricing information using long and thin bars that resemble candlesticks and each candlestick denotes the movement of price over the period of selected time. Each candlestick shows four specific prices for the currency pair, i.e., open, close, high and low.
HLOC or Bar chart:
HLOC also denotes the high, low, open, and close in the chart, the same as the candlestick chart but in a different way. Here, the bar chart is used to denote the same figures. Open price is denoted by the left vertical line, close price by the right vertical line, high price by the uppermost point of the vertical line and low price by the lowest point of the vertical line.
Line chart:
Line charts do not show open, high and low prices like HOLC or candlestick charts. Instead, they are used to denote only close prices for the selected time. The closed prices are joined together to make a line chart.
Mountain chart:
It is the same as a line chart, where only closed prices are marked and joined to make the line. But below the allied lines, the area is shaded, giving it a mountain-like appearance, hence the name mountain chart.
How to Read Candlesticks in Forex
- Open Price: The price when the candle starts
- Close Price: Where the price ends in the selected timeframe
- Wicks/Shadows: Show highs and lows
- Body: Wide = volatile, Small = indecisive
Popular Candlestick Patterns:
- Doji – Market indecision
- Engulfing – Reversal signal
- Hammer – Bullish reversal after downtrend
- Shooting Star – Bearish reversal after uptrend
Tips to Study Forex Charts Effectively
- Start with one currency pair (e.g., EUR/USD)
- Focus on daily or 4-hour charts for clarity
- Learn to spot support and resistance zones
- Combine charts with news and economic data
- Use demo accounts before risking real money
- Don’t overcomplicate—avoid 10 indicators at once
- Journal your trades and chart analysis to learn from mistakes
Mistakes to Avoid
- Relying only on indicators
- Ignoring fundamentals
- Trading without confirming trends
- Jumping between multiple strategies
- Overtrading on small timeframes (like 1-minute charts)
Real-Life Scenario
Let’s say you spot an engulfing bullish candle near a support level on the EUR/USD daily chart.
→ This could be a signal to buy
→ Confirm it with volume or news
→ Set your stop-loss below the support zone
FAQs
Q1: What’s the best chart type for beginners?
Candlestick charts. They’re visual and intuitive once you learn patterns.
Q2: How often should I check charts?
Stick to your trading plan. For swing trading, once a day is enough.
Q3: Do charts predict the future?
No. They show probabilities, not certainties. Always manage your risk.
Conclusion:
Forex charts are your window into the market. Mastering them takes practice, patience, and a clear system. Don’t rush—learn one pattern at a time, journal everything, and trust the process.
Want help setting up your charting tools or choosing the right platform? Contact Uptick Technology — we’ll guide you from beginner to confident trader.
Also Read: What are the Right Steps for DevSecOps Implementation?